Failures in Open-Pit Mines and Uncertainty when Predicting Collapses

 GroundProbe’s Group Geotechnical Sales Specialist, Albert Cabrejo
With the introduction of the Slope Stability Radar (SSR) by GroundProbe in 2001, the mining industry acquired the ability to gather monitoring data of collapses in real-time. The Inverse Velocity (IV) Method, by Professor Fukuzono has been used in the mining industry along with slope monitoring radars for almost a decade to predict collapses. However, Fukuzono’s method has limitations in successfully predicting collapses due to the varying characteristics of failure in rock masses.
Predicting the Failure Time of a Slope using Fukuzono’s Method
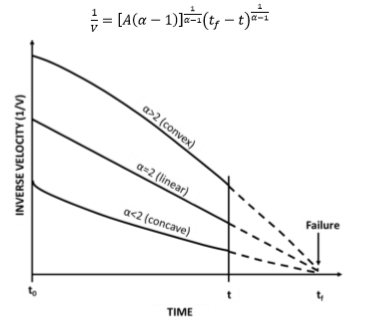
In 1985, Fukuzono first introduced his method of predicting collapses and outlined different shapes of IV versus time – convex, linear and concave. Applying this to mining sites, the intersection with the time horizontal axis determines the collapse time of a wall and all operations and activities are to be carried out based on that date and time (see Figure 1).
Figure 1: Different IV Plots Versus Time

Effect of the Time Window on the Velocity Calculation
The application of Fukuzono’s method is simple, however could lead to different velocity results depending on the width of the time window used. In a decelerating deformation movement (convex), the longer the time window, the higher the velocity and the shorter the time window, the lower the velocity. Comparatively, in a linear deformation movement, the length of the time window does not introduce any change to the result. In an accelerating deformation movement (concave), the longer the time window, the lower the velocity and the shorter the time window, the higher the velocity.
For example, after impact, an instable wedge could experience some initial regressive deformation and after a certain level of strain the wedge collapses without any restriction in front of it. These types of failures over a short time window, such as one hour, tend to show linear trends. However, when this failure occurs over a longer time window, such as 24 hours, acceleration increases over time and a bend-down shaped (concave) trend appears.
When acceleration does not change within different time windows, linear behaviour is again present. When the rock mass deforms and changes its geometry as it slides down, the lower end of the material can work as a growing buttress for the rest of the material above. In this case, convex behaviour is present, whereby there is increased acceleration, which is reduced over time and results in a bend-up effect.
By applying Fukuzono’s method to real monitoring data, it can be concluded that to effectively detect early deformation rates, a longer time window should be used for velocity analysis. The longer time windows allow for the early detection of an ongoing deformation process. However, the shorter time windows are more accurate at estimating the time of failure, as they are affected by the most recent deformation state of the rock mass.
The Challenge of Forecasting a Collapse
Geotechnical practitioners need to monitor and forecast a collapse to minimise the risk of injury and damage to employees, equipment, and operations. However, the different IV plots Fukuzono refers to are not always applicable to the mining industry and are only applicable to a limited set of failures – where the acceleration tends to be constant and absent of strain-softening processes and other stresses.
In a mining environment, failures are likely to include the breaking of rock bridges, which result in a dramatic change in the condition of materials from a solid rock mass to dislocated loose material. These failures have a high correlation with strain hardening and strain softening processes. The recovery of the cohesion and the friction in a dislocated rock mass is not likely to occur in a mining environment, due to ongoing stresses in the environment breaking any new bonding process.
Another limitation of the IV method is that collapses always occur before the IV reaches zero. Therefore, it is unsafe to use the IV plots and trust that the collapse will take place near that time.
Collapse Statistics
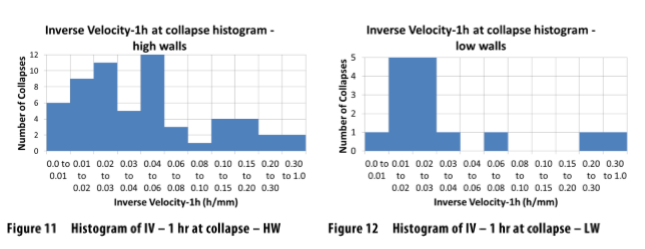
A total of 74 collapses were analysed, 59 in highwalls and 15 in lowwalls. The two variables – minimum IV values and collapse forecast error – were measured using different time windows of one hour and 24 hours. The objective was to understand the errors that an experienced geotechnical engineer might incur while trying to predict when a collapse will occur, using Fukuzono’s method. The error (E) is the difference between the actual collapse time (as measured by SSR) and the forecast collapse time – determined by extrapolating the IV until it intersects the time axis. The difference in time is the error, which could be on the safe side (forecast before the collapse) or on the unsafe side (forecast after the collapse). The collapse was defined at the point where any progressive plot changed its accelerated behaviour to either static or decelerated.
Minimum IV at Collapse, 1 Hour and 24 Hours
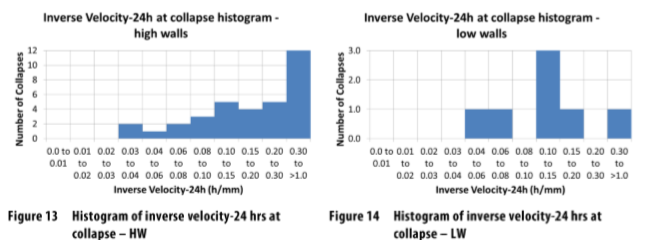
Figure 13 and 14 show the importance of using different inverse velocity thresholds to assess the likelihood of collapse based on the time window. For example, this difference is highlighted for a value of IV between 0.3 and 1.0 for both the 1-hour velocity analysis and the 24-hour velocity analysis; the former has two collapses while the latter has 12 collapses in the histograms for highwalls.


Collapse Forecast Error (E)
For each collapse, a forecast of impending failure was made before the failure. The bars between -24 hours to -1-hour error (E) in the histograms correspond to the cases where the collapse forecast fell within 24 and 1 hour before the actual collapse. These are likely to have been on the safe side, allowing for the removal of most of the equipment and all the personnel.
The bars between -1 hour and 0 hours correspond to the cases where the collapse prediction fell within 0 to 1 hour from the actual collapse, which might be just enough time to remove some machinery and personnel.
The bars between 0 hours and 24 hours correspond to the cases where the collapse prediction was after the actual collapse, which may result in a serious risk of loss of personnel and equipment.
There are many unsuccessful forecasts in these histogram bars, for all of the scenarios. The late forecasted cases correspond to materials that experienced strain softening and did not build any buttress in front to help mitigate the acceleration process. The assumption that the IV = 0 at the collapse time led to a late collapse forecast. The data was too noisy, the correct configuration of the time window was not used, or the radar was deployed too late during the collapse process. The radar was used as a reactive tool, rather than a preventative tool in most of the cases.
Most of the unsuccessful forecasts were made when using 24 hours as the velocity calculation period. This validates the hypothesis that longer time windows are useful for early detection of collapses, however, do not provide an accurate prediction of the time of the collapse.
The results in Table 2 show the estimated errors that should be considered when forecasting a failure. For example, the 95th percentile for HW IV1h indicates that in 5 per cent of the cases the collapse will occur 08:30 hours before the forecasted time to collapse. Likewise, the 70th percentile for LW IV24h indicates that in 30 per cent of the cases the actual collapse will occur 06:00 hours before the forecasted time to collapse. These statistical parameters should be considered when forecasting collapses and for alarm definition based on the velocity of deformation.

Conclusion
Fukuzono’s IV method has proven to be successful in many slope instability cases in open-pit mines. However, its application requires a rigorous understanding of the variables.
The magnitude of the errors for the 74 cases reviewed is worryingly on the unsafe side. Evidence suggests that failures always occur before the intersection of any IV plot (concave, linear and convex) with the time axis. Fukuzono’s method is more likely to forecast a failure after the collapse occurs rather than before it.
The radar software for the calculation of the velocity and IV needs the flexibility to allow different configurations. The safest recommendation is to choose a range of velocity and IV calculations using different time windows, maximising the chance of early detection and for an accurate forecast.
When using IV with a 1-hour time window in highwalls, evacuations should be called about 08:30 hours before the time of collapse forecast and 10:30 hours for low walls. If the IV with a 24-hour time window is used, highwalls should be cleared 21:20 hours before the time of collapse forecast and low walls 10:20 hours before the forecast. This sort of approach tends to maximise safety however, productivity might be reduced if the collapses occur at the lowest percentiles.
Read more
This article is a summary of the paper Analysis of failures in open-pit mines and consideration of the uncertainty when predicting collapses by A.G. Cabrejo-Liévano. Read the full paper here.


